LED Grow Light Fundamentals - Part 2
Verifying and Comparing Lighting Designs: Why You Shouldn’t Take Our Word (Or Any Vendor’s Word) at Face Value
Knowing how to independently verify lighting design information and compare proposals on equal footing empowers commercial growers, operators, and owners to make more informed capital decisions
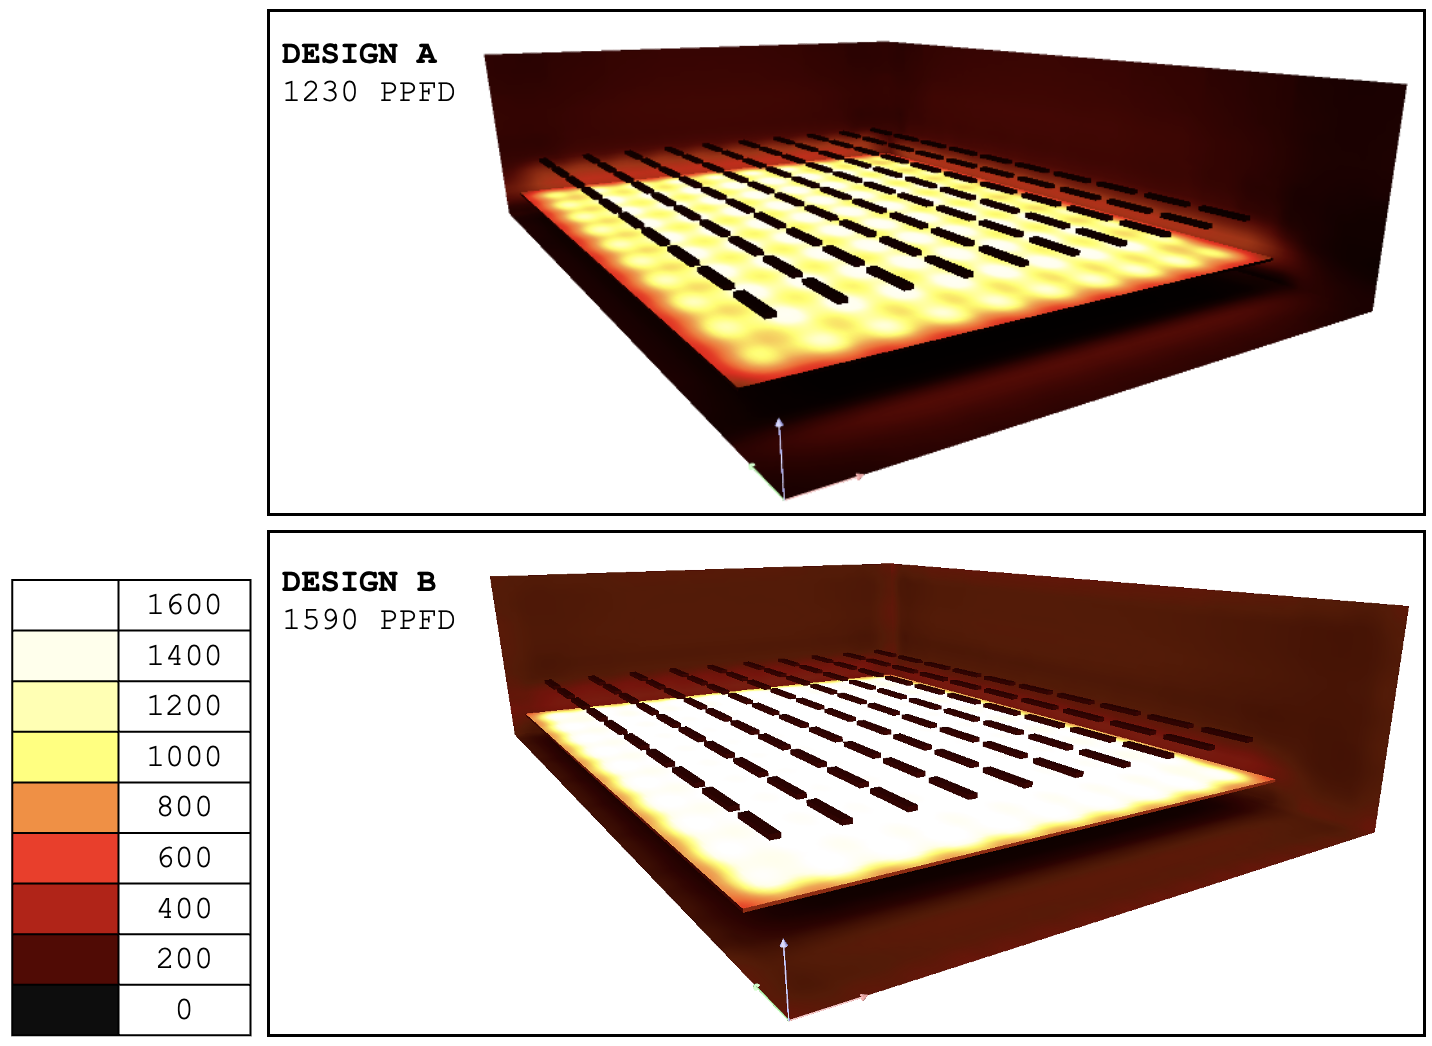
At first glance, Design B appears to be the superior proposal — showcasing roughly 30% higher PPFD than Design A.
In reality, both designs are based on the exact same lighting equipment. The only difference lies in the settings used within the lighting design software. So which one should you trust?
When purchasing commercial horticulture lighting, there are many variables to evaluate (see Part 1 of our LED Grow Light Fundamentals series for a quick summary), but ultimately, every design comes down to one question: How many usable photons are reaching your canopy?
PPF vs. PPFD: Understanding the Relationship
Most growers are familiar with PPFD — the metric used to describe light intensity at the plant canopy. However, PPF is equally important (and often underutilized) as a verification tool when it comes to lighting designs.
PPF (Photosynthetic Photon Flux):
The lighting design input that determines what is possible.
Measured in micromoles per second (µmol/s), PPF represents the total number of photosynthetically active photons emitted by a fixture every second.
PPFD (Photosynthetic Photon Flux Density):
The lighting design outcome that drives plant performance.
Measured in micromoles per square meter per second (µmol/m²/s), PPFD represents how many photons actually land on your plant canopy.
Why PPF Is the Objective Anchor
Reputable horticulture lighting manufacturers publish PPF on their spec sheets, and it can be validated through independent third-party testing (UL, DLC, accredited labs, etc.).
PPFD, however, is not measured directly from a fixture. It is a modeled output derived from lighting design software and/or calculated from field measurements — and therefore subject to user inputs and assumptions such as: wall reflectivity, mounting height, grid spacing, area of analysis, calculation points, sensor calibration, etc.
Without consistency in modeling/measurements, you may find yourself reviewing apples-to-oranges lighting design proposal from multiple vendors. That is why PPF serves as the objective cross-check.
The Simple Math Behind Lighting Design
Basic math provides a fast reality check. If a vendor claims they can achieve the same (or higher) PPFD as another based on less PPF, skepticism is warranted. Physics does not change between proposals.
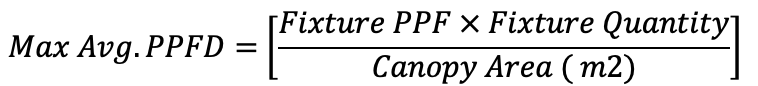
The highest real-world average PPFD a lighting design can theoretically deliver can be calculated with a simple formula:
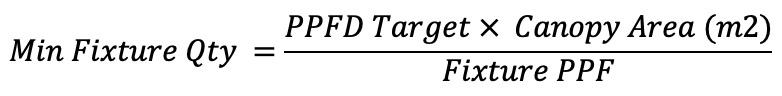
Rearranged, the formula can also determine the minimum fixture quantity required to reach the theoretically max average PPFD:
A Practical Comparison Rule
When reviewing multiple lighting proposals: compare total PPF between designs, and ensure totals are within ±5%. If one design claims equivalent/higher PPFD with meaningfully lower total PPF, investigate the modeling assumptions.
Remember, when it comes to lighting designs: you are buying photons — not fixtures.
What This Doesn’t Address
Verifying lighting designs is one part of the equation when deciding on what horticulture lighting equipment to deploy.. Comparing fixtures themselves — reliability, efficacy, spectrum, thermal management, certifications, warranty, Q90 performance, IP rating, etc. — is another. In our next Primer: Equipment Specifications & Deployment Considerations, we’ll examine the critical system-level variables that determine long-term performance and ROI.
In the meantime, if you’d like a simple Excel calculator to verify modeled PPFD, compare vendor proposals, and stress-test fixture quantities, fill out the form below and we’ll send you a complimentary copy.